|
|
Epidemiological Update forDengue, Chikungunya and Zika in 2023.Updated: Jan 1 2026 9:16AM |
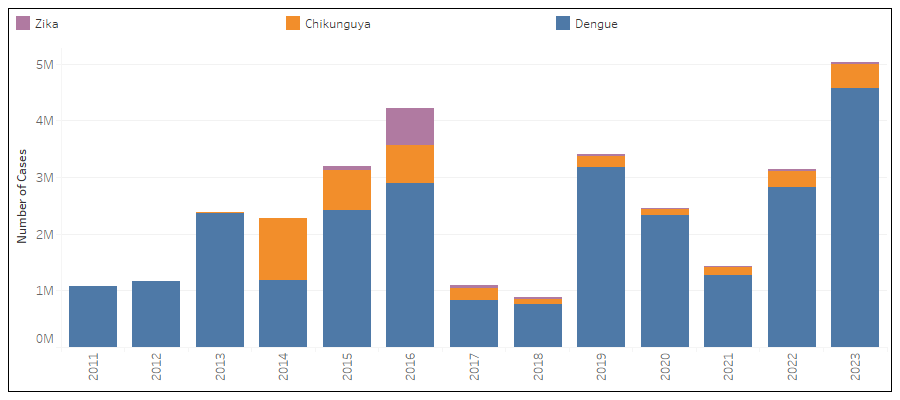
Arboviral situation summaryIn the Region of the Americas, between epidemiological week (EW) 1 and EW 52 of 2023, a total of 5,027,493 cases of arboviral disease were reported. Of those, 4,578,274 ( 91.1 % ) were dengue cases, 411,560 ( 8.2 % ) chikungunya cases, and 37,659 ( 0.8 % ) were Zika cases. Country specific data on case counts and completeness can be found at https://www.paho.org/plisa The thirteen-year pattern of circulation of these arboviruses is depicted in (Figure 1)., which shows that the introduction of chikungunya in December of 2013 and high transmission observed in 2014. Similarly, following the introduction of Zika in 2015, there was widespread circulation of the virus in 2015. Nevertheless, dengue circulation has continued to predominate. |
Updated data as of epidemiological week 52 for Dengue, 52 for chikungunya and 52 for Zika of 2023
DENGUE4,578,274 cases 449.36 cases x 100,000 Pop. 9,160 severe dengue (0.2%) 2,470 deaths 0.054% case fatality rate (CFR) Saint Bartolome is he country with the highest cumulative incidence CHIKUNGUNYA 411,560 cases 40.58 cases x 100,000 Pop. 515 deaths 0.125 % case fatality rate (CFR) Paraguay is he country with the highest cumulative incidence ZIKA 37,659 cases 3.75 cases x 100,000 Pop. 0 deaths 0.000 % case fatality rate (CFR) Belize is he country with the highest cumulative incidence |
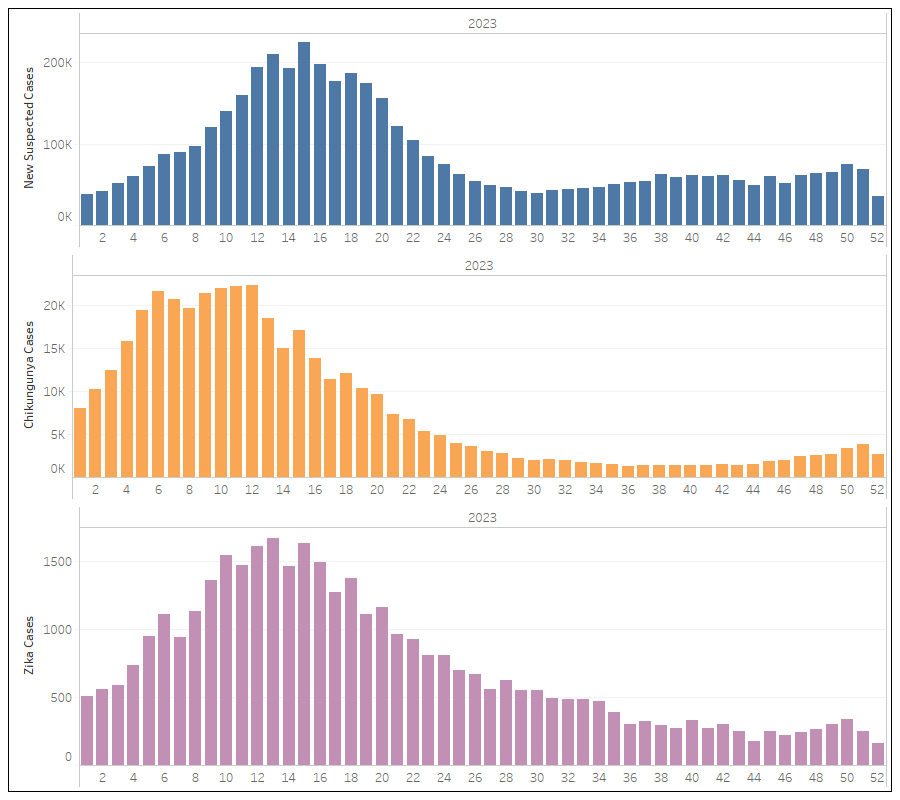
In the Region of the Americas, the total number of cases of arboviral disease reported in 2023 as of 52 represents 60.0 % relative increase compared to the same period in 2022. It is worth noting that in 2023 dengue peaked at EW 15, whereas chikungunya peaked in EW 12. For the same time period, Zika circulation was stronger in the first semester of 2023, however, its circulation pattern is less pronounced, as case counts are much smaller and many countries do not notify cases of Zika (Figure 2).
Figure 2. Distribution of cases of dengue,
chikungunya, and Zika by epidemiological week (EW),
Region of The Americas, 2023.
 Source:Data entered into the Health Information Platform for The
Americas (PLISA, PAHO / WHO)
Source:Data entered into the Health Information Platform for The
Americas (PLISA, PAHO / WHO)
by the Ministries
and Institutes of Health of the countries and territories of the Region.
Available at: https://www.paho.org/plisa
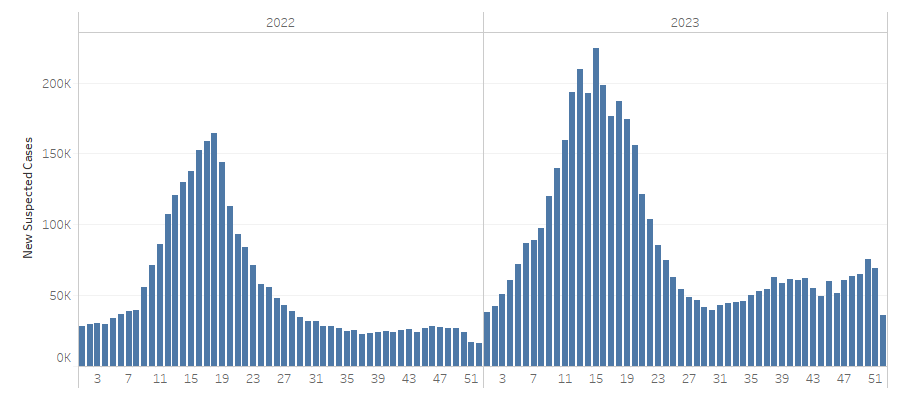
Between EW 1 and 52 of 2023, a total of 4,578,274 cases of dengue were reported in the Region of the Americas, with a cumulative incidence of 449.36 cases per 100,000 population. The year 2023 yielded the highest number of dengue cases since the Pan American Health Organization started collecting dengue case data in 1980. The year 2023 started with intense dengue transmission earlier in the year, peaking in EW 15. The rate of growth of the curve in Figure 3 for 2022 was 481%, from EW 1 until peak on EW 18, while the rate of growth for the curve in 2023 was 493%, from EW 1 until peak on EW 15.
Figure 3. Distribution of Regional dengue cases
by epidemiological week in The Americas, 2022-2023.
 Source:Data entered into the Health Information Platform for
The Americas (PLISA, PAHO / WHO)
Source:Data entered into the Health Information Platform for
The Americas (PLISA, PAHO / WHO)
by the Ministries
and Institutes of Health of the countries and territories of the Region.
Available at: https://www.paho.org/plisa
As of EW 52 of 2023, the highest number of dengue cases in the Region have been reported by the following countries: Brazil with 3,064,739 cases (66.9%), Mexico with 277,963 cases (6.1%), Peru with 256,641 cases (5.6%), Nicaragua with 181,096 cases (4.0%), and Bolivia with 158,744 cases (3.5%). Distribution of incidence of dengue by subregion is presented in Figure 4. Note that the case counts for the ten countries in the Region account for 3,939,183 total cases or 86.0% of the total cases of dengue.
Figure 4. Cumulative incidence of dengue cases per 100,000 population. Region of The Americas, 2023.
 Source:Data entered into the Health Information Platform for The Americas (PLISA, PAHO / WHO)
by the Ministries
and Institutes of Health of the countries and territories of the Region. Available at: https://www.paho.org/plisa
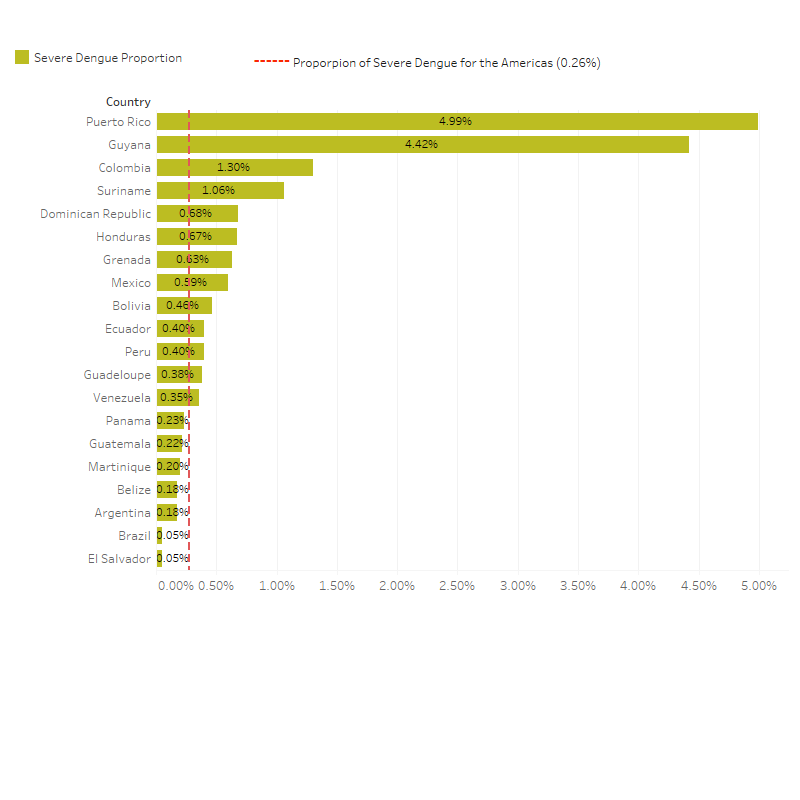
In 2023, of the total of cases reported in the Region, 2,074,834 (45.3%) were laboratory-confirmed and 9,160 (0.2%) were classified as severe dengue (Figure 5). The highest number of severe dengue cases were reported by the following countries: Colombia with 1,714 cases (18.7%), Mexico with 1,653 cases (18.0%), Brazil with 1,627 cases (17.8%), Guyana with 1,236 cases (13.5%), and Peru with 1,017 cases (11.1%).
Figure 5 describes the proportion of severe dengue cases among all cases of dengue reported. 15 countries have reported higher proportion of severe cases than the regional mean of 0.20. Of note, the countries reporting the greatest proportion of severe cases among total dengue cases in 2023 were Suriname, (1.06%), Colombia, (1.3%), Guyana, (4.42%), Puerto Rico, (4.99%) .
Figure 5. Proportion of severe dengue. Countries and territories of The Americas, 2023.
 Source:Data entered into the Health Information Platform for The Americas (PLISA, PAHO / WHO)
by the Ministries
and Institutes of Health of the countries and territories of the Region. Available at: https://www.paho.org/plisa
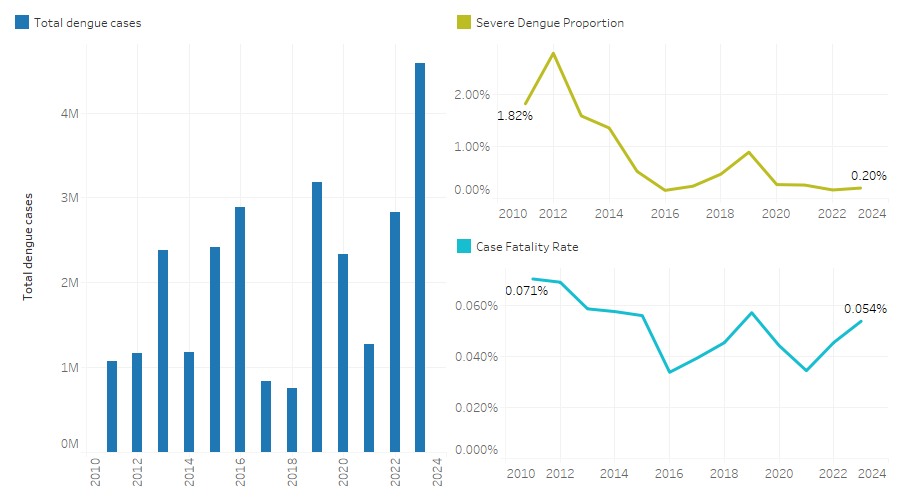
Figure 6 below includes the pattern of dengue cases in the Americas since 2010. Also included in Figure 6 is the Regional, 10-year trend of the proportion of severe cases among all dengue cases and the proportion of dengue deaths among all dengue cases (case fatality rate, or CFR). Additionally, during the same period, a total of 2,470 deaths were reported in the Region (CFR: 0.054%).
Figure 6. Distribution of reported dengue cases, proportion of
severe dengue cases and case fatality rate trends. Region of the Americas, 2023.
 Source:Data entered into the Health Information Platform for The Americas (PLISA, PAHO / WHO)
by the Ministries
and Institutes of Health of the countries and territories of the Region. Available
at: https://www.paho.org/plisa
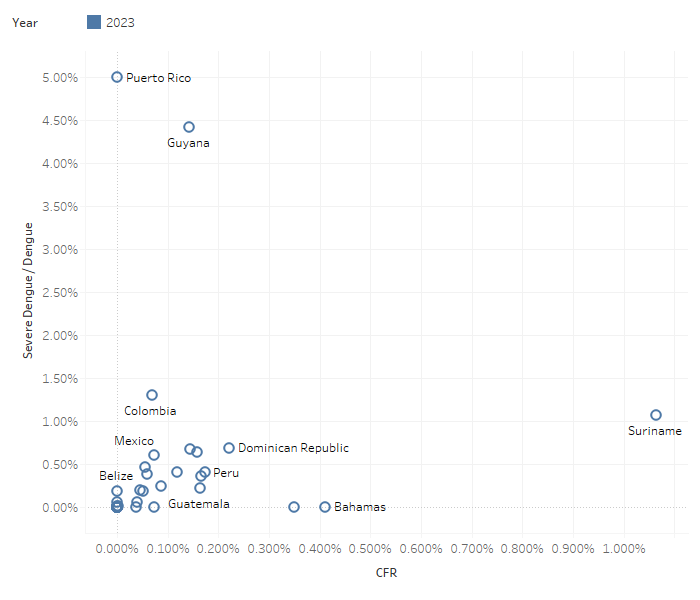
In Figure 7 below, we can see a scatterplot of two variables used to monitor the severity of dengue seasons�the Dengue Case Fatality Rate (CFR or the proportion of how many cases of dengue die from the virus among all cases of the virus) and the proportion of severe cases among all dengue cases. This scatterplot attempts to visually demonstrate how these two variables are correlated. In this scatter plot we would expect to see a positive correlation. That means that as countries observe more severe cases, we would expect a greater proportion of these cases die.
Figure 7. Scatter plot of CFR and Proportion of severe cases for 2023.
 Source:Data entered into the Health Information Platform for The Americas (PLISA, PAHO / WHO)
by the Ministries
and Institutes of Health of the countries and territories of the Region. Available
at: https://www.paho.org/plisa
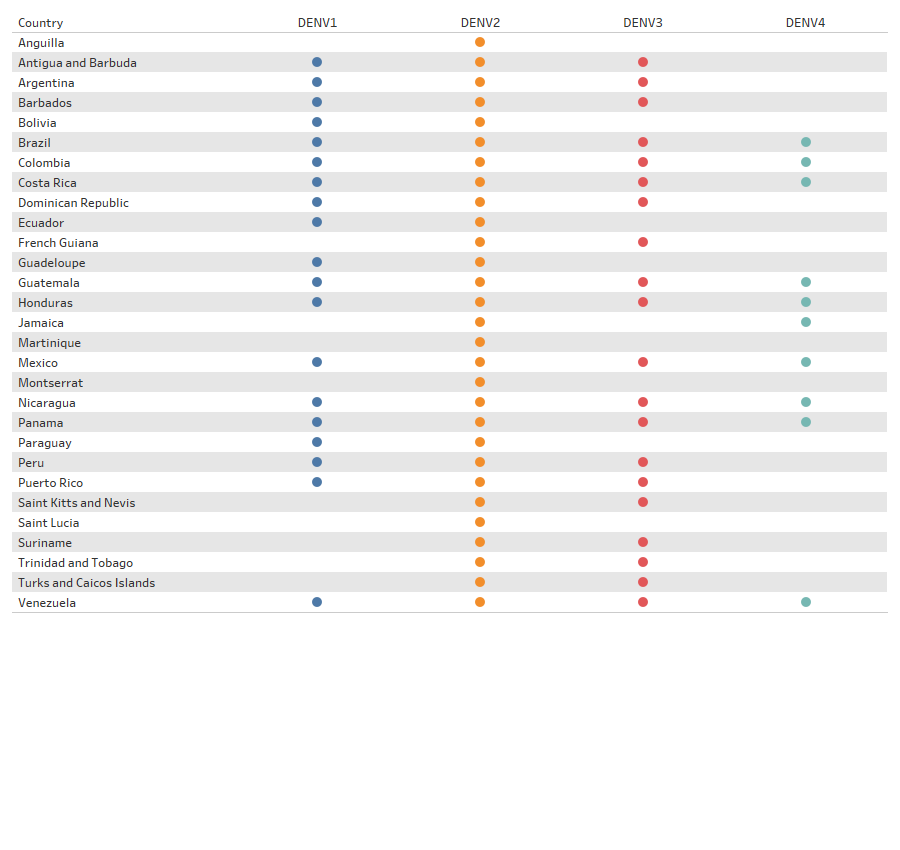
All four dengue virus serotypes (DENV 1, DENV 2, DENV 3, DENV 4) were present in the Americas Region in 2023. Brasil , Colombia , Costa Rica , Guatemala , Honduras , M�xico , Nicaragua , Panam� , Venezuela reported the detection of all four serotypes in 2023. Dengue serotype circulation by country is detailed in Figure 8.
Figure 8. Geographic distribution of serotypes in the region of The Americas, 2023.
 Source:Data entered into the Health Information Platform for The Americas (PLISA, PAHO / WHO)
by the Ministries
and Institutes of Health of the countries and territories of the Region. Available at: https://www.paho.org/plisa
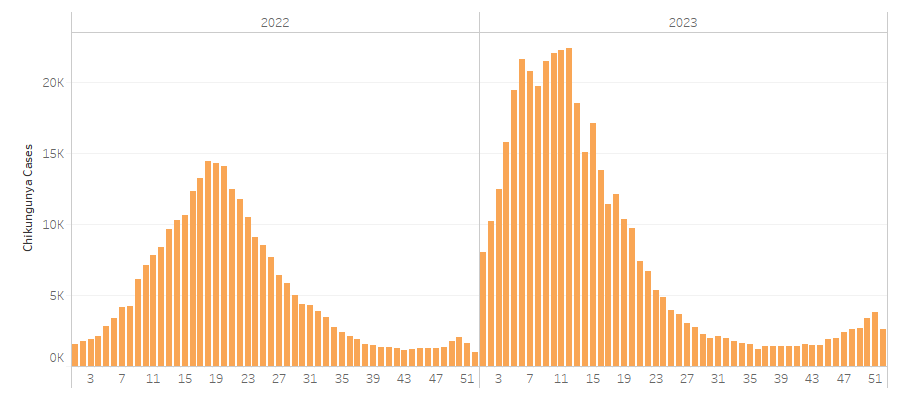
Between EW 1 and EW 52 of 2023, a total of 411560 chikungunya cases were reported in 18 of the 52 countries and territories in the Region of the Americas, of which 240168 were confirmed (58.4 %). The regional cumulative incidence for chikungunya in 2023 was of 40.58 cases per 100,000 population. The rate of growth of the curve for 2022 was 813%, from EW 1 until peak on EW 18 , while the rate of growth for the curve in 2023 was 181% , from EW 1 until peak on EW 12. 515 deaths were reported associated with chikungunya infection.
Figure 9. Chikungunya cases per epidemiological week (EW). Region of the Americas. 2022-2023
 Source:Data entered into the Health Information Platform for The Americas (PLISA, PAHO / WHO)
by the Ministries
and Institutes of Health of the countries and territories of the Region. Available at:
https://www.paho.org/plisa
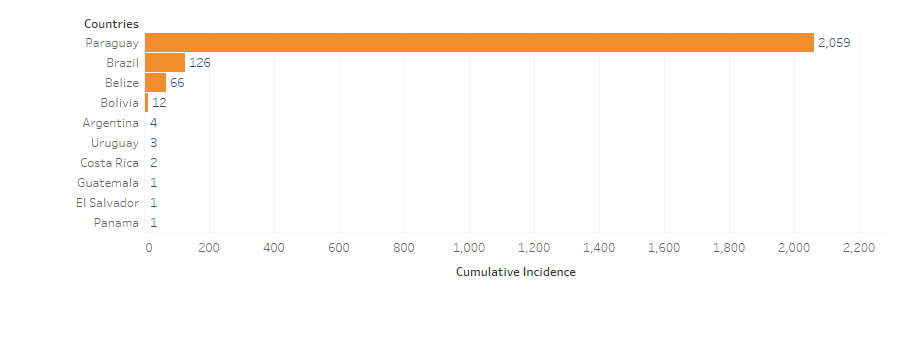
As of EW 52 of 2023, the highest number of chikungunya cases in the Region have been reported by Brazil, with 266,297 cases, which represents (64.7 %) of total regional cases. Paraguay follows in case counts with 140,905 cases (34.2 %), followed by Argentina with 1,746 cases (0.4 %), Bolivia with 1,468 cases (0.4 %), and Belize with 272 cases (0.1%). During the same period, 515 deaths attributed to chikungunya infection were reported. The countries with the highest incidence are incluided in Figure 10.
Figure 10. Cumulative incidence of chikungunya cases per 100,000 population. Region of the Americas 2023.
 Source:Data entered into the Health Information Platform for The Americas (PLISA, PAHO / WHO)
by the Ministries
and Institutes of Health of the countries and territories of the Region. Available at: https://www.paho.org/plisa
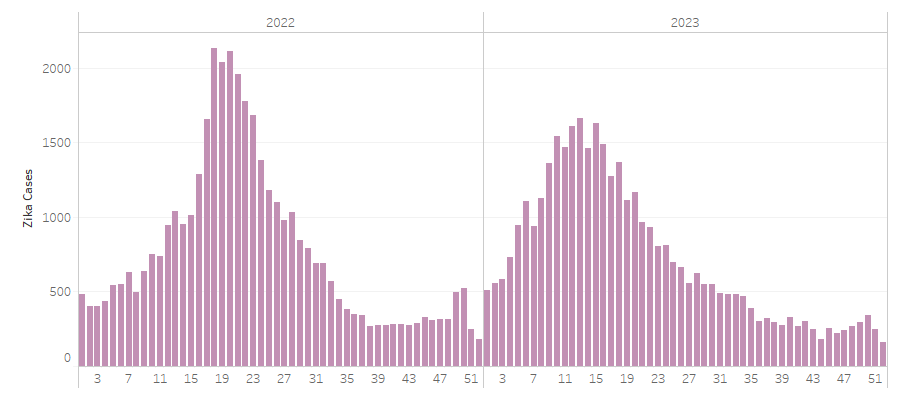
Between EW 1 and EW 52 of 2023, a total of 37,659 of Zika have been reported in the Region of the Americas in 15 out of 52 countries and territories. Of all reported cases, 4,084 were lab-confirmed (10.8%). The 37,659 represents a cumulative incidence 3.75 cases per 100,000 population. Only 0 Zika-related death was reported for the year. Since its first detection in Brazil in March of 2014, local transmission of Zika has been confirmed in all countries and territories in the Americas, except for continental Chile, Uruguay, and Canada (Figure 11).
Figure 11. Distribution of reported cases
of Zika by epidemiological
week. Region of the Americas. 2022-2023
 Source:Data entered into the Health Information Platform for The
Americas (PLISA, PAHO / WHO)
Source:Data entered into the Health Information Platform for The
Americas (PLISA, PAHO / WHO)
by the Ministries
and Institutes of Health of the countries and territories of the Region.
Available at: https://www.paho.org/plisa
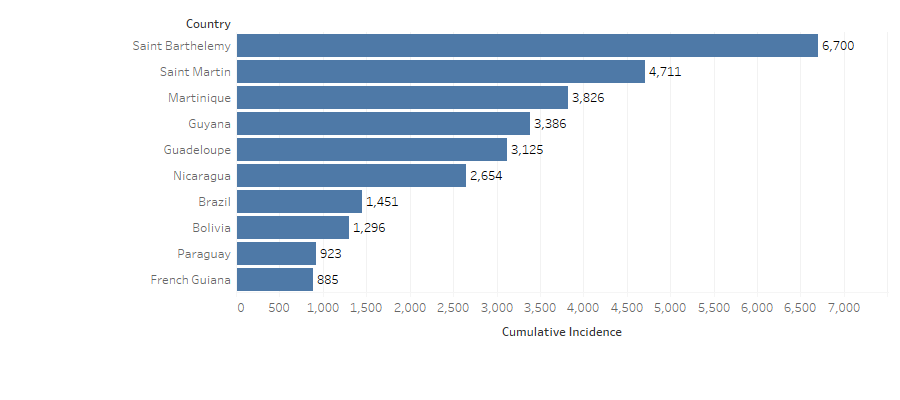
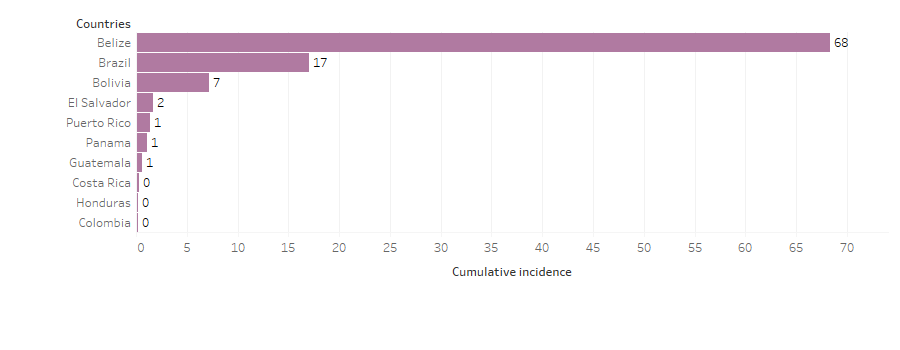
The highest numbers of Zika cases in the Region were reported in the following countries: Brazil with 35,962 cases ( 95.5 %), Bolivia with 881 cases ( 2.3 %), Belize with 281 cases ( 0.7 %), Colombia with 116 cases ( 0.3 %), and Guatemala with 112 cases ( 0.3 %) of cases in the Region. The five countries with the highest cumulative incidence are included in Figure 12
Figure 12. Cumulative incidence of Zika cases per 100,000 population.
Region of the Americas 2023.
 Source:Data entered into the Health Information Platform for The Americas (PLISA, PAHO / WHO)
by the Ministries
and Institutes of Health of the countries and territories of the Region. Available at: https://www.paho.org/plisa
------ Note: As information is updated, PLISA automatically updates data, including retroactively. Therefore, data for any given time period may change as countries update their data.