|
|
Epidemiological Update forDengue, Chikungunya and Zika in 2022.Updated: Feb 17 2026 1:00AM |
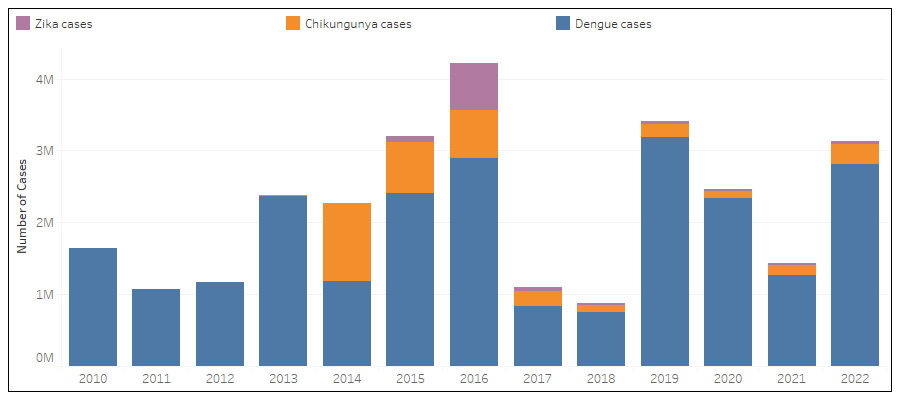
Arboviral situation summaryIn the Region of the Americas, between epidemiological week (EW) 1 and EW 52 of 2022, a total of 3,141,351 cases of arboviral disease were reported. Of those, 2,826,982 ( 90.0 % ) were dengue cases, 273,841 ( 8.7 % ) chikungunya cases, and 40,528 ( 1.3 % ) were Zika cases. Country specific data on case counts and completeness can be found at https://www.paho.org/plisa The thirteen-year pattern of circulation of these arboviruses is depicted in (Figure 1)., which shows that the introduction of chikungunya in December of 2013 is clearly observed in 2014. Similarly, following the introduction of Zika in 2015, there was widespread circulation of the virus in 2015. Nevertheless, dengue circulation has continued to predominate. |
Updated data as of epidemiological week 52 for Dengue, 52 for chikungunya and 52 for Zika of 2022
DENGUE2,826,982 cases 273.46 cases x 100,000 Pop. 4,615 severe dengue (0.2%) 1,289 deaths 0.046% case fatality rate (CFR) Nicaragua is he country with the highest cumulative incidence CHIKUNGUNYA 273,841 cases 27.47 cases x 100,000 Pop. 87 deaths 0.032 % case fatality rate (CFR) Belize is he country with the highest cumulative incidence ZIKA 40,528 cases 4.06 cases x 100,000 Pop. 2 death 0.005 % case fatality rate (CFR) Belize is he country with the highest cumulative incidence |
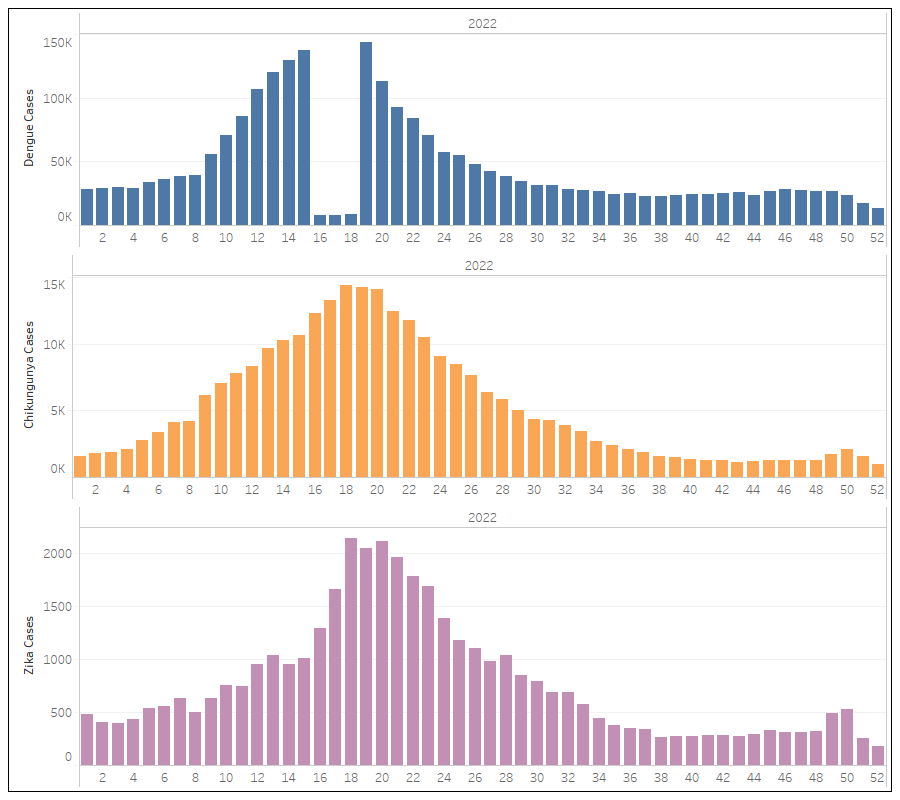
In the Region of the Americas, the total number of cases of arboviral disease reported in 2022 as of 52 represents approximately 119.6 % relative increase compared to the same period in 2021. It is worth noting that in 2022 dengue peaked at EW 18, whereas chikungunya peaked in EW 18. For the same time period, Zika circulation was stronger in the first semester of 2022, however, its circulation pattern is less pronounced, as case counts are much smaller and many countries do not notify cases of Zika (Figure 2).
Figure 2. Distribution of cases of dengue,
chikungunya, and Zika by epidemiological week (EW),
Region of The Americas, 2022.
 Source:Data entered into the Health Information Platform for The
Americas (PLISA, PAHO / WHO)
Source:Data entered into the Health Information Platform for The
Americas (PLISA, PAHO / WHO)
by the Ministries
and Institutes of Health of the countries and territories of the Region.
Available at: https://www.paho.org/plisa
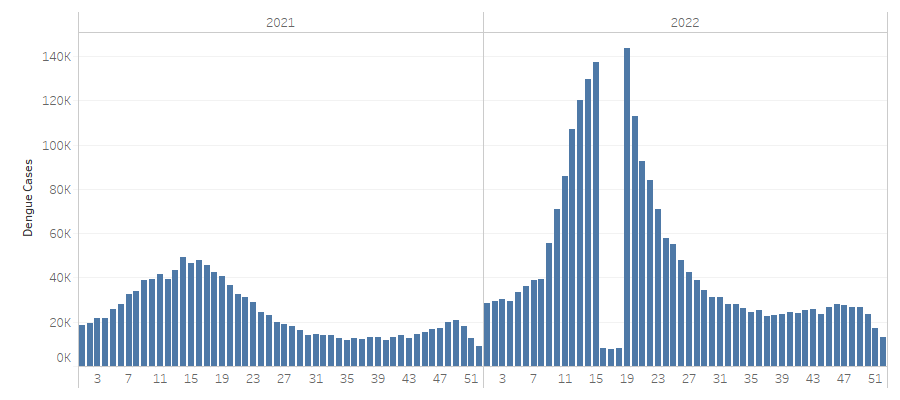
Between EW 1 and 52 of 2022, a total of 2,826,982 cases of dengue were reported in the Region of the Americas, with a cumulative incidence of 273.46 cases per 100,000 population. The year 2019 yielded the highest number of dengue cases since the Pan American Health Organization started collecting dengue case data in 1980. The peak for cases in 2019 was observed in EW 14. The year 2022 started with intense dengue transmission earlier in the year, peaking in EW 18, when most countries began imposing social distancing and lockdown measures due to COVID-19 and dengue transmission observed an important decline. The rate of growth of the curve in Figure 3 for 2021 was 165%, from EW 1 until peak on EW 14, while the rate of growth for the curve in 2022 was 481%, from EW 1 until peak on EW 18.
Figure 3. Distribution of Regional dengue cases
by epidemiological week in The Americas, 2021-2022.
 Source:Data entered into the Health Information Platform for
The Americas (PLISA, PAHO / WHO)
Source:Data entered into the Health Information Platform for
The Americas (PLISA, PAHO / WHO)
by the Ministries
and Institutes of Health of the countries and territories of the Region.
Available at: https://www.paho.org/plisa
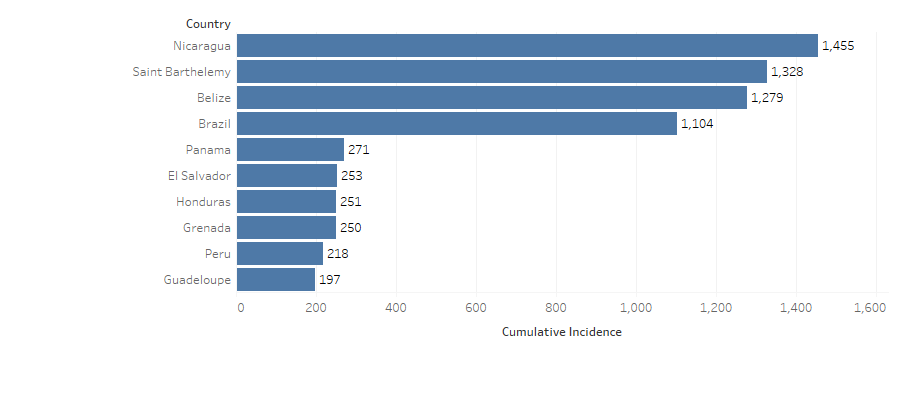
As of EW 52 of 2022, the highest number of dengue cases in the Region have been reported by the following countries: Brazil with 2,363,490 cases (83.6%), Nicaragua with 97,541 cases (3.5%), Peru with 72,851 cases (2.6%), Colombia with 69,497 cases (2.5%), and Mexico with 59,918 cases (2.1%). Distribution of incidence of dengue by subregion is presented in Figure 4. Note that the case counts for the ten countries in the Region account for 2,663,297 total cases or 94.2% of the total cases of dengue.
Figure 4. Cumulative incidence of dengue cases per 100,000 population. Region of The Americas, 2022.
 Source:Data entered into the Health Information Platform for The Americas (PLISA, PAHO / WHO)
by the Ministries
and Institutes of Health of the countries and territories of the Region. Available at: https://www.paho.org/plisa
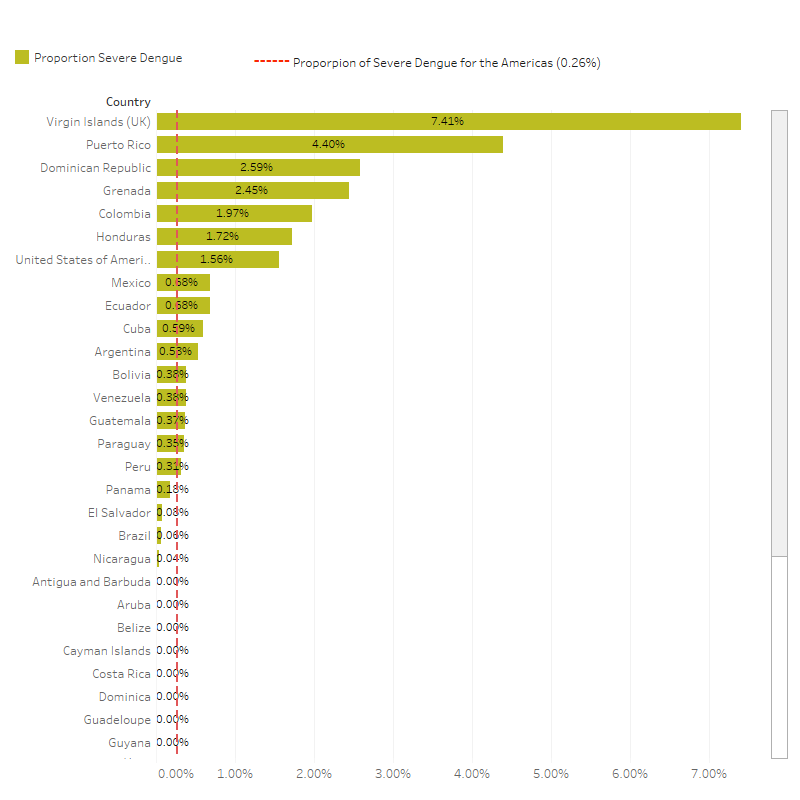
In 2022, of the total of cases reported in the Region, 1,374,385 (48.6%) were laboratory-confirmed and 4,615 (0.2%) were classified as severe dengue (Figure 5). The highest number of severe dengue cases were reported by the following countries: Brazil with 1,450 cases (31.4%), Colombia with 1,371 cases (29.7%), Honduras with 436 cases (9.4%), Mexico with 410 cases (8.9%), and Dominican Republic with 279 cases (6.0%).
Figure 5 describes the proportion of severe dengue cases among all cases of dengue reported. 17 countries have reported higher proportion of severe cases than the regional mean of 0.17. Of note, the countries reporting the greatest proportion of severe cases among total dengue cases in 2022 were United States, (1.56%), Honduras, (1.72%), Colombia, (1.97%), Grenada, (2.39%), Dominican Republic, (2.59%), Puerto Rico, (4.4%), British Virgin Islands, (7.41%) .
Figure 5. Proportion of severe dengue. Countries and territories of The Americas, 2022.
 Source:Data entered into the Health Information Platform for The Americas (PLISA, PAHO / WHO)
by the Ministries
and Institutes of Health of the countries and territories of the Region. Available at: https://www.paho.org/plisa
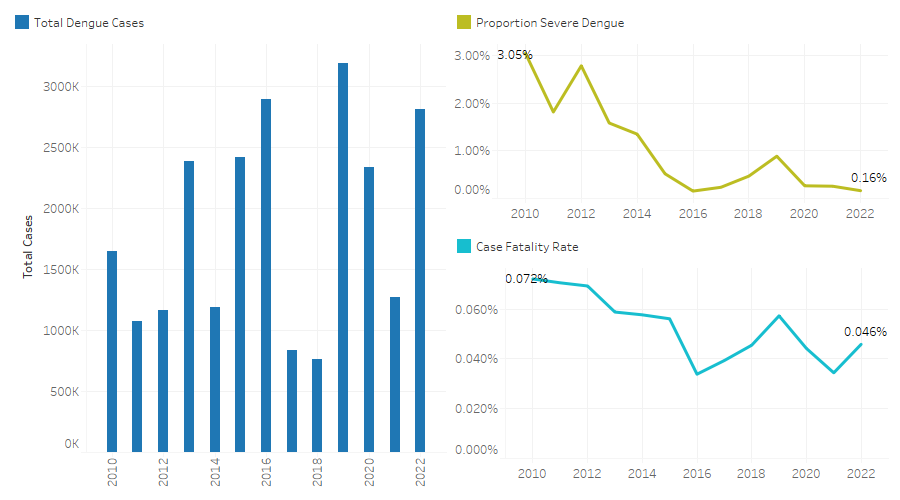
Figure 6 below includes the pattern of dengue cases in the Americas since 2008. Also included in Figure 6 is the Regional, 10-year trend of the proportion of severe cases among all dengue cases and the proportion of dengue deaths among all dengue cases (case fatality rate, or CFR). Additionally, during the same period, a total of 1,289 deaths were reported in the Region (CFR: 0.046%).
Figure 6. Distribution of reported dengue cases, proportion of
severe dengue cases and case fatality rate trends. Region of the Americas, 2022.
 Source:Data entered into the Health Information Platform for The Americas (PLISA, PAHO / WHO)
by the Ministries
and Institutes of Health of the countries and territories of the Region. Available
at: https://www.paho.org/plisa
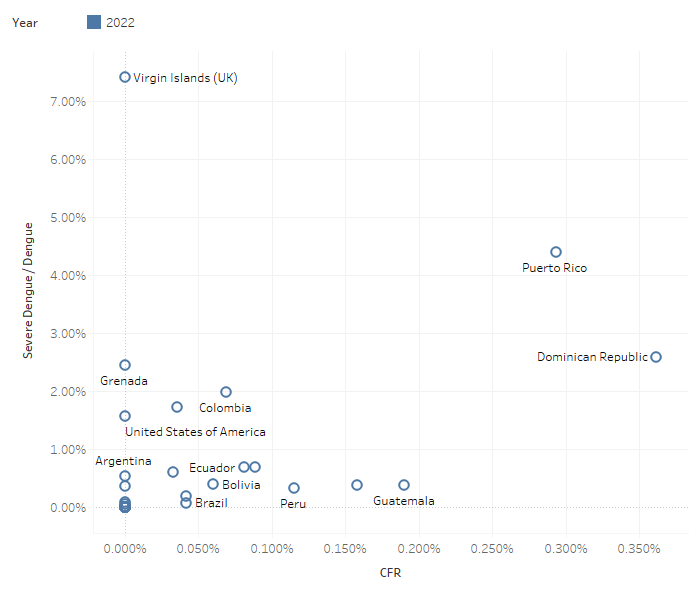
In Figure 7 below, we can see a scatterplot of two variables used to monitor the severity of dengue seasons�the Dengue Case Fatality Rate (CFR or the proportion of how many cases of dengue die from the virus among all cases of the virus) and the proportion of severe cases among all dengue cases. This scatterplot attempts to visually demonstrate how these two variables are correlated. In this scatter plot we would expect to see a positive correlation. That means that as countries observe more severe cases, we would expect a greater proportion of these cases die.
Figure 7. Scatter plot of CFR and Proportion of severe cases for 2022.
 Source:Data entered into the Health Information Platform for The Americas (PLISA, PAHO / WHO)
by the Ministries
and Institutes of Health of the countries and territories of the Region. Available
at: https://www.paho.org/plisa
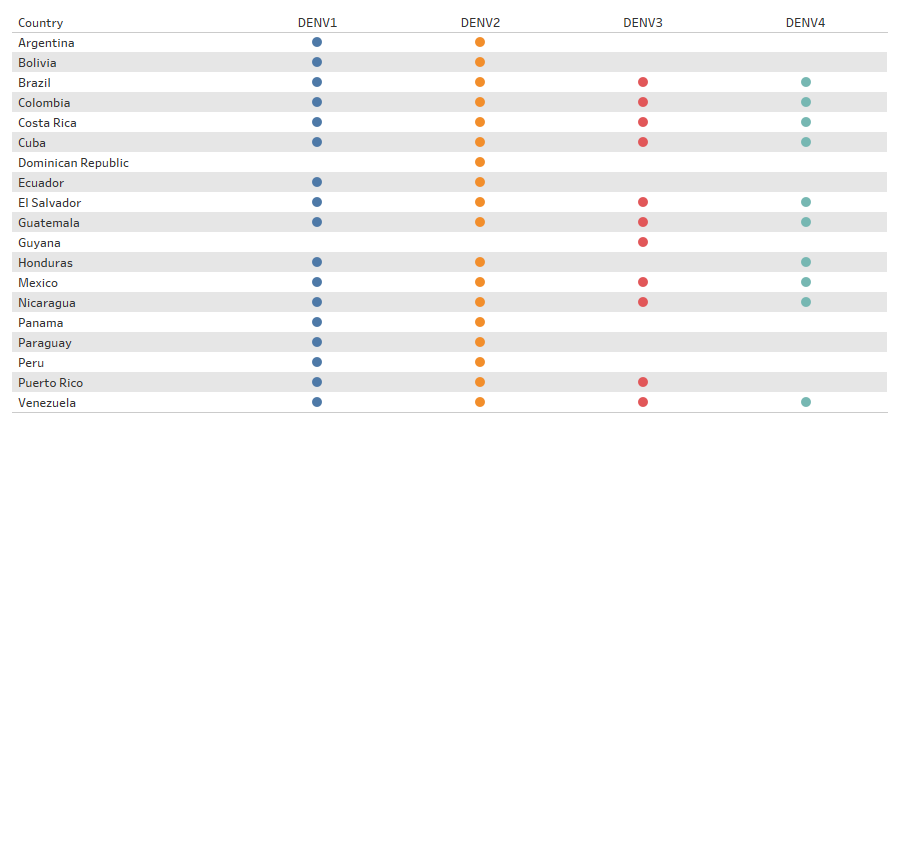
All four dengue virus serotypes (DENV 1, DENV 2, DENV 3, DENV 4) were present in the Americas Region in 2022. Brazil , Colombia , Costa Rica , Cuba , El Salvador , Guatemala , Mexico , Nicaragua , Venezuela reported the detection of all four serotypes in 2022. Dengue serotype circulation by country is detailed in Figure 8.
Figure 8. Geographic distribution of serotypes in the region of The Americas, 2022.
 Source:Data entered into the Health Information Platform for The Americas (PLISA, PAHO / WHO)
by the Ministries
and Institutes of Health of the countries and territories of the Region. Available at: https://www.paho.org/plisa
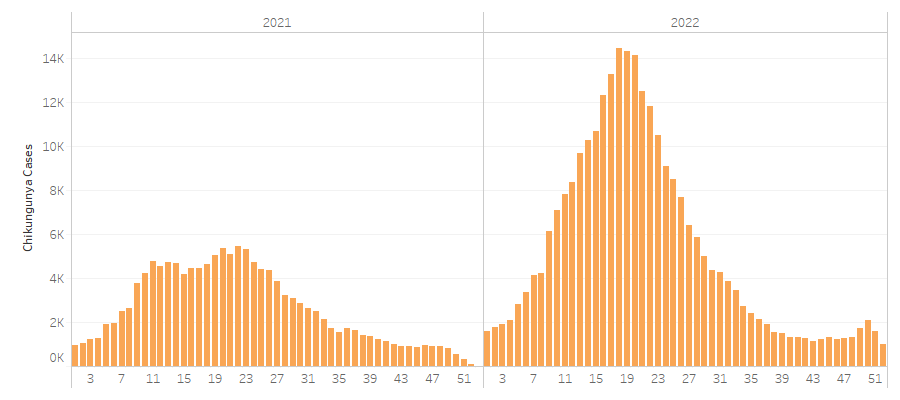
Between EW 1 and EW 52 of 2022, a total of 273841 chikungunya cases were reported in 14 of the 52 countries and territories in the Region of the Americas, of which 138594 were confirmed (50.6 %). The regional cumulative incidence for chikungunya in 2022 was of 27.47 cases per 100,000 population. The rate of growth of the curve for 2021 was 487%, from EW 1 until peak on EW 22 , while the rate of growth for the curve in 2022 was 813% , from EW 1 until peak on EW 18. Peak transmission was in EW 22 for 2021 and in EW 18 for 2022. 87 deaths were reported associated with chikungunya infection.
Figure 9. Chikungunya cases per epidemiological week (EW). Region of the Americas. 2021-2022
 Source:Data entered into the Health Information Platform for The Americas (PLISA, PAHO / WHO)
by the Ministries
and Institutes of Health of the countries and territories of the Region. Available at:
https://www.paho.org/plisa
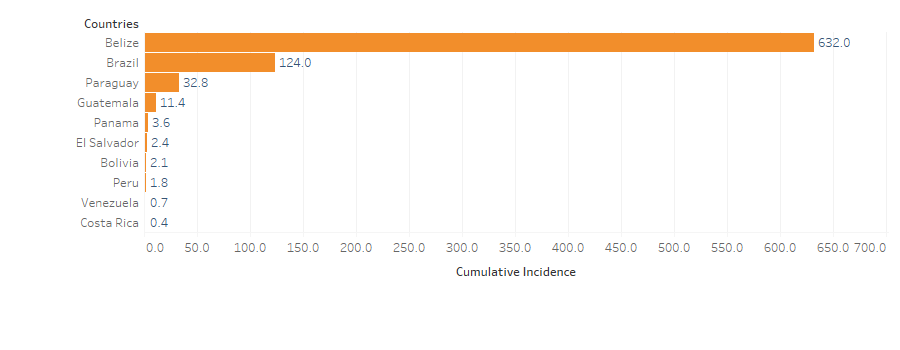
As of EW 52 of 2022, the highest number of chikungunya cases in the Region have been reported by Brazil, with 265,289 cases, which represents (96.9 %) of total regional cases. Belize follows in case counts with 2,509 cases (0.9 %), followed by Paraguay with 2,443 cases (0.9 %), Guatemala with 2,086 cases (0.8 %), and Peru with 595 cases (0.2%). During the same period, 87 deaths attributed to chikungunya infection were reported. The countries with the highest incidence are incluided in Figure 10.
Figure 10. Cumulative incidence of chikungunya cases per 100,000 population. Region of the Americas 2022.
 Source:Data entered into the Health Information Platform for The Americas (PLISA, PAHO / WHO)
by the Ministries
and Institutes of Health of the countries and territories of the Region. Available at: https://www.paho.org/plisa
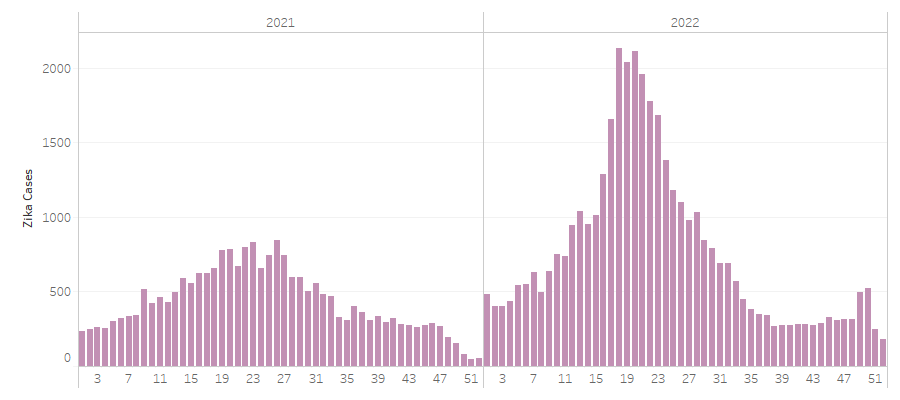
Between EW 1 and EW 52 of 2022, a total of 40,528 of Zika have been reported in the Region of the Americas in 15 out of 52 countries and territories. Of all reported cases, 3,547 were lab-confirmed (8.8%). The 40,528 represents a cumulative incidence 4.06 cases per 100,000 population. Only 2 Zika-related death was reported for the year. Since its first detection in Brazil in March of 2014, local transmission of Zika has been confirmed in all countries and territories in the Americas, except for continental Chile, Uruguay, and Canada (Figure 11). 2 deaths were reported associated with Zika infection.
Figure 11. Distribution of reported cases
of Zika by epidemiological
week. Region of the Americas. 2021-2022
 Source:Data entered into the Health Information Platform for The
Americas (PLISA, PAHO / WHO)
Source:Data entered into the Health Information Platform for The
Americas (PLISA, PAHO / WHO)
by the Ministries
and Institutes of Health of the countries and territories of the Region.
Available at: https://www.paho.org/plisa
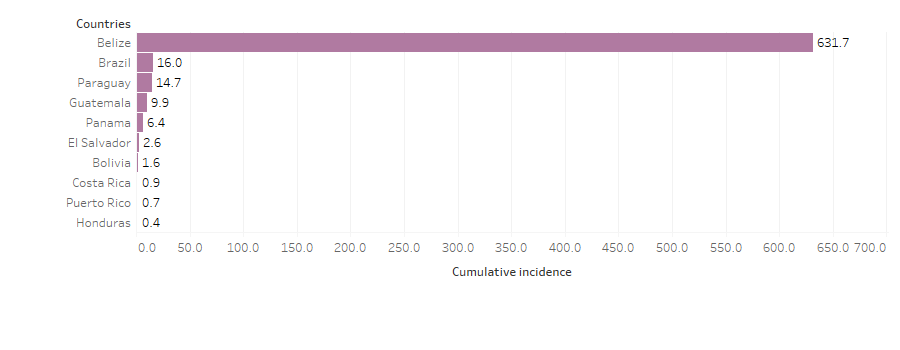
The highest numbers of Zika cases in the Region were reported in the following countries: Brazil with 34,176 cases ( 84.3 %), Belize with 2,508 cases ( 6.2 %), Guatemala with 1,815 cases ( 4.5 %), Paraguay with 1,094 cases ( 2.7 %), and Panama with 282 cases ( 0.7 %) of cases in the Region. The five countries with the highest cumulative incidence are included in Figure 12
Figure 12. Cumulative incidence of Zika cases per 100,000 population.
Region of the Americas 2022.
 Source:Data entered into the Health Information Platform for The Americas (PLISA, PAHO / WHO)
by the Ministries
and Institutes of Health of the countries and territories of the Region. Available at: https://www.paho.org/plisa
------ Note: As information is updated, PLISA automatically updates data, including retroactively. Therefore, data for any given time period may change as countries update their data.