|
|
Annual Epidemiological Update for Dengue, Chikungunya and Zika in 2020Updated: Jan 16 2026 1:00AM |
In the Region of the Americas, between epidemiological week (EW) 1 and EW 53 of 2020, a total of 2,454,746 cases of arboviral disease were reported. Of these, 2,328,722 ( 94.9 % ) were dengue cases, 103,046 ( 4.2 % ) chikungunya cases, and 22,978 ( 0.9 % ) were Zika cases. Country specific data on case counts and completeness can be found at https://www.paho.org/plisa
The thirteen-year pattern of circulation of these arboviruses is depicted in (Figure 1)., which shows that the introduction of chikungunya in December of 2013 is clearly observed in 2014. Similarly, following the introduction of Zika in 2015, there was widespread circulation of the virus in 2015. Nevertheless, dengue circulation has continued to predominate.
Figure 1. Distribution of reported cases of
dengue, chikungunya, and Zika by year. Region of
The Americas. 2008-2020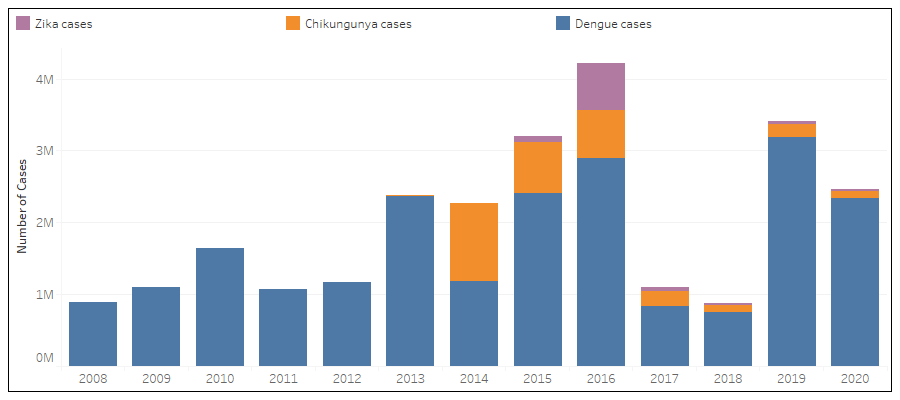 Source: Data entered into the Health Information Platform for The
Americas (PLISA, PAHO / WHO)
Source: Data entered into the Health Information Platform for The
Americas (PLISA, PAHO / WHO)
by the Ministries
and Institutes of Health of the countries and territories of the Region.
Available at: https://www.paho.org/plisa
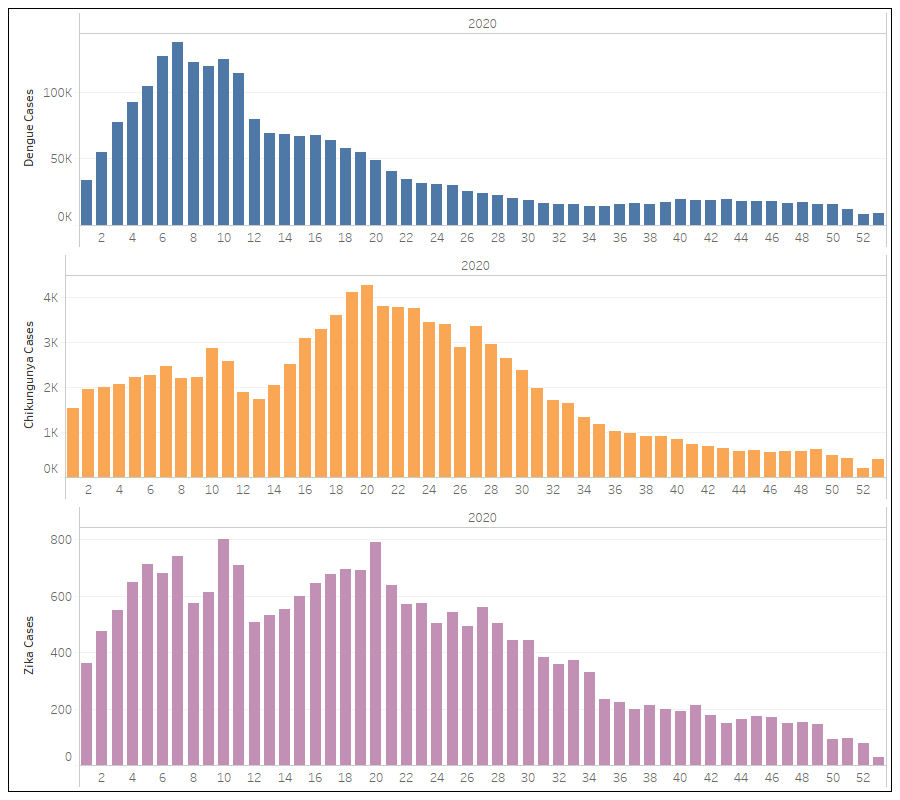
In the Region of the Americas, the total number of cases of arboviral disease reported in 2020 as of EW 53 represents approximately 27.9 % relative decrease compared to the same period in 2019. It is worth noting that in 2020 dengue peaked at EW 7, whereas chikungunya peaked in EW 20. For the same time period, Zika circulation was stronger in the first semester of 2020, however, its circulation pattern is less pronounced, as case counts are much smaller and many countries do not notify cases of Zika (Figure 2).
Figure 2. Distribution of cases of dengue,
chikungunya, and Zika by epidemiological week (EW),
Region of The Americas, 2020.
 Source:Data entered into the Health Information Platform for The
Americas (PLISA, PAHO / WHO)
Source:Data entered into the Health Information Platform for The
Americas (PLISA, PAHO / WHO)
by the Ministries
and Institutes of Health of the countries and territories of the Region.
Available at: https://www.paho.org/plisa
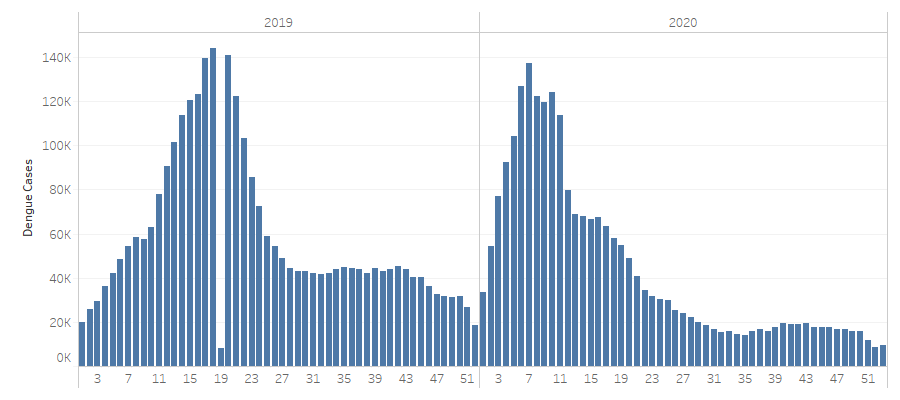
Between EW 1 and 53 of 2020, a total of 2,328,722 cases of dengue were reported in the Region of the Americas, with a cumulative incidence of 227.33 cases per 100,000 population. The year 2019 yielded the highest number of dengue cases since the Pan American Health Organization started collecting dengue case data in 1980. The peak for cases in 2019 was observed in EW 19. The year 2020 started with intense dengue transmission earlier in the year, peaking in EW 7. After this week, a significant decrease in cases of this disease was observed, when most countries began to impose social distancing measures and stay at home due to the introduction of the SARS-CoV-2 pandemic. Normally in the region during the last five years, the highest number of cases have been reported between EW 14 and EW 24.
The rate of growth of the curve in Figure 3 for 2020 between 1 and EW 7 was 309% while the rate of growth for the same period in 2019 was 170%.
Figure 3. Distribution of Regional dengue cases
by epidemiological week in The Americas, 2019-2020.
 Source:Data entered into the Health Information Platform for
The Americas (PLISA, PAHO / WHO)
Source:Data entered into the Health Information Platform for
The Americas (PLISA, PAHO / WHO)
by the Ministries
and Institutes of Health of the countries and territories of the Region.
Available at: https://www.paho.org/plisa
As of EW 53 of 2020, the highest number of dengue cases in the Region have been reported by the following countries: Brazil with 1,467,142 cases (63.0%), Paraguay with 223,782 cases (9.6%), Mexico with 120,639 cases (5.2%), Bolivia with 111,347 cases (4.8%), and Colombia with 78,979 cases (3.4%). These five countries add up to a total of 2,001,889 cases of dengue, that is, 86.0% of the cases registered in the Region.
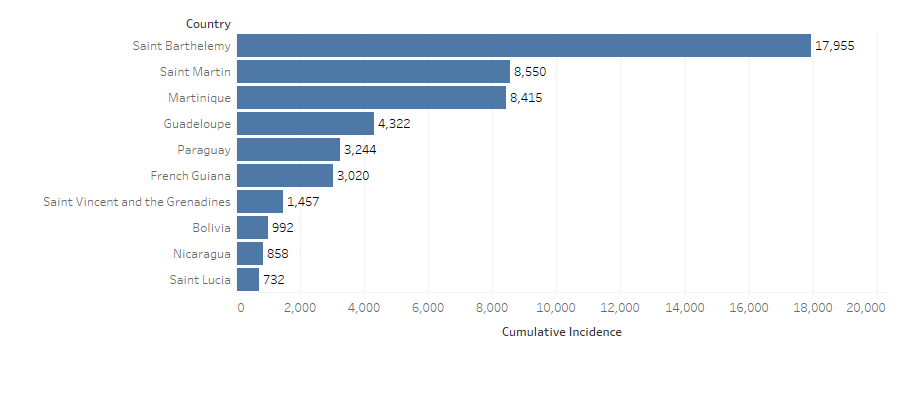
The countries with the highest incidence rate are Paraguay (3389.1), Guadaloupe (4768.3), Saint Martin (8825.81), Martinique (9100.56), Saint Bartolome (16160), cases per 100,000 population (Figure 4)
Figure 4. Cumulative incidence of dengue cases per 100,000 population. Region of The Americas, 2020.
 Source:Data entered into the Health Information Platform for The Americas (PLISA, PAHO / WHO)
by the Ministries
and Institutes of Health of the countries and territories of the Region. Available at: https://www.paho.org/plisa
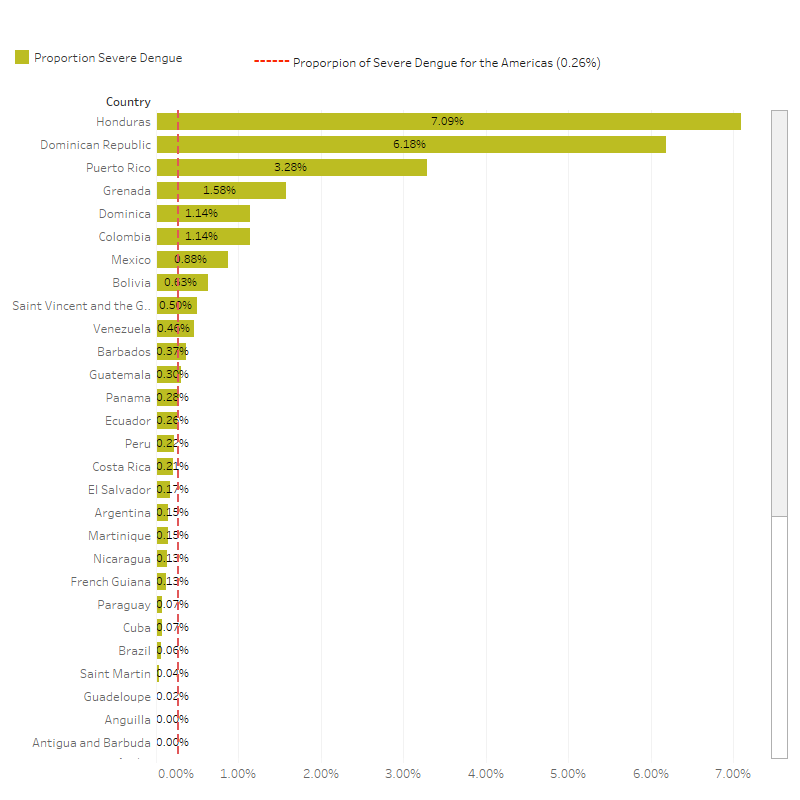
In 2020, of the total of cases reported in the Region, 1,026,064 (44.1%) were laboratory-confirmed and 6,208 (0.3%) were classified as severe dengue (Figure 5). The highest number of severe dengue cases were reported by the following countries: Honduras with 1,786 cases (28.8%), Mexico with 1,058 cases (17.0%), Colombia with 897 cases (14.4%), Brazil with 828 cases (13.3%), and Bolivia with 696 cases (11.2%).
Figure 5 describes the proportion of severe dengue cases among all cases of dengue reported. 14 countries have reported higher proportion of severe cases than the regional mean of 0.27. Of note, the countries reporting the greatest proportion of severe cases among total dengue cases in 2019 were Dominica, (1.14%), Colombia, (1.14%), Grenada, (1.58%), Puerto Rico, (3.28%), Dominican Republic, (6.18%), Honduras, (7.09%) .
Figure 5. Proportion of severe dengue. Countries and territories of The Americas, 2020.
 Source:Data entered into the Health Information Platform for The Americas (PLISA, PAHO / WHO)
by the Ministries
and Institutes of Health of the countries and territories of the Region. Available at: https://www.paho.org/plisa
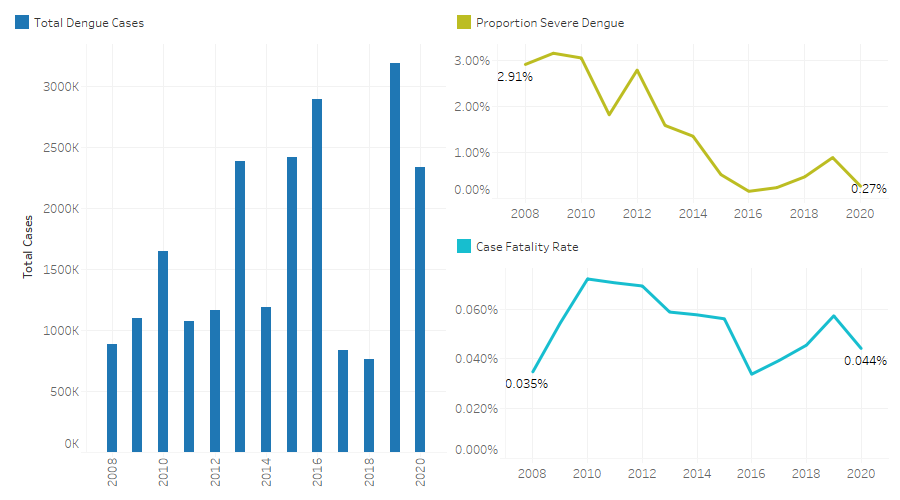
Figure 6 below includes the pattern of dengue cases in the Americas since 2008. Also included in Figure 6 is the Regional, 20-year trend of the proportion of severe cases among all dengue cases and the proportion of dengue deaths among all dengue cases (case fatality rate, or CFR). Additionally, during the same period, a total of 1,034 deaths were reported in the Region (CFR: 0.044%).
Figure 6. Distribution of reported dengue cases, proportion of
severe dengue cases and case fatality rate trends. Region of the Americas, 2020.
 Source:Data entered into the Health Information Platform for The Americas (PLISA, PAHO / WHO)
by the Ministries
and Institutes of Health of the countries and territories of the Region. Available
at: https://www.paho.org/plisa
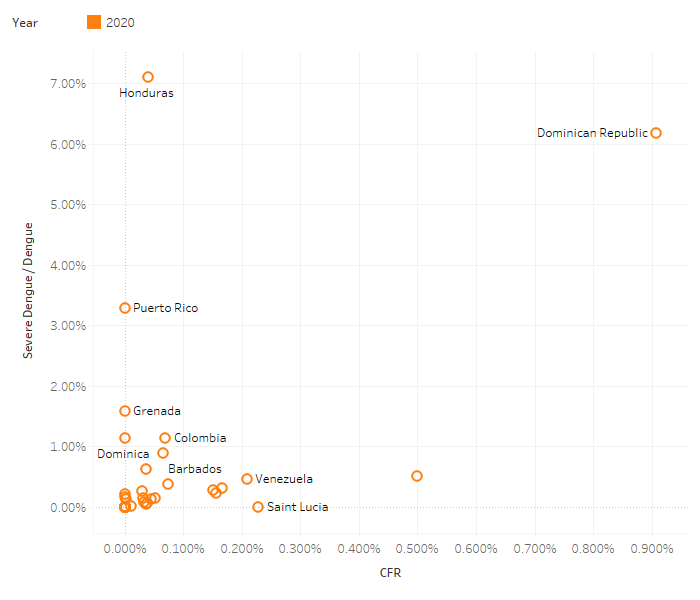
In Figure 7, a scatter diagram is observed that correlates two variables used to monitor the severity of dengue seasons: the case fatality rate of dengue (the proportion of how many dengue cases die from the virus among all dengue cases) and the proportion of severe cases (number of severe cases occurring among all dengue cases). It would be expected to observe a positive correlation, that is, as a greater number of severe cases occur in the countries, there would be a greater proportion of cases that die.
This is observed in Dominican Republic, which has the highest fatality in the Region and highest proportion of severe cases among all dengue cases. However, there are countries that are outside the expected pattern such Honduras and Puerto Rico that have a significantly higher proportion of severe dengue cases than most other countries and low fatality. In contrast, Saint Vincent and the Grenadines show a low proportion of severe cases that progress to death.
Figure 7. Scatter plot of CFR and Proportion of severe cases for 2020.
 Source:Data entered into the Health Information Platform for The Americas (PLISA, PAHO / WHO)
by the Ministries
and Institutes of Health of the countries and territories of the Region. Available
at: https://www.paho.org/plisa
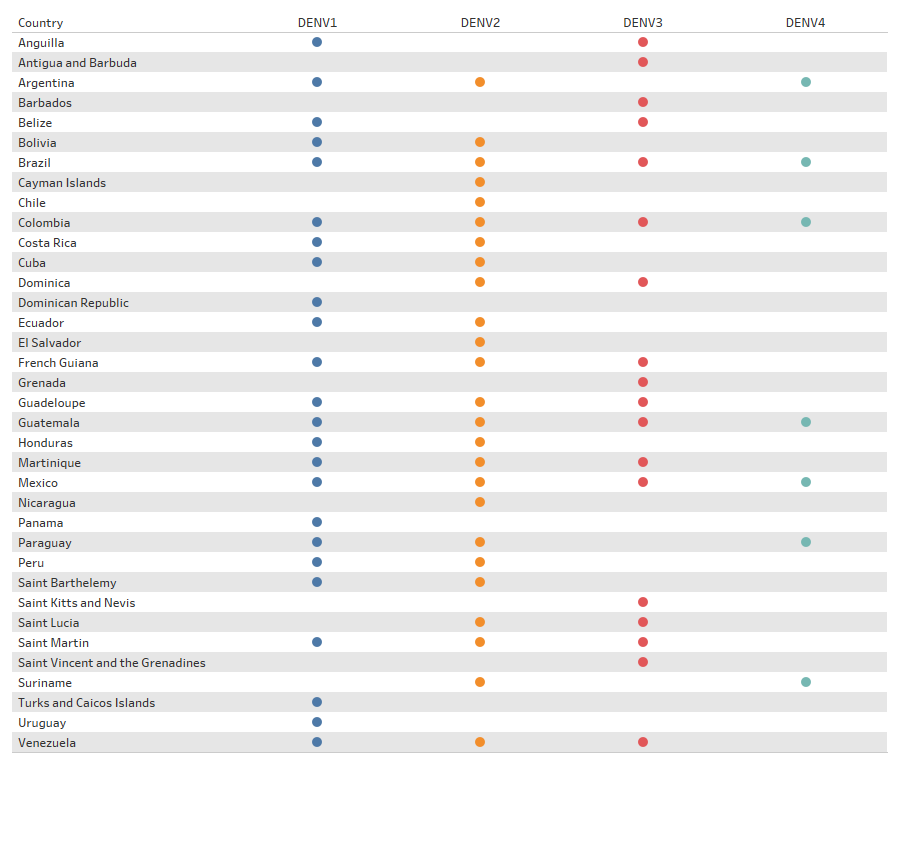
All four dengue virus serotypes (DENV 1, DENV 2, DENV 3, DENV 4) were present in the Americas Region in 2020. Brazil , Colombia , Guatemala , Mexico reported the detection of all four serotypes in 2020. Dengue serotype circulation by country is detailed in Figure 8.
Figure 8. Geographic distribution of serotypes in the region of The Americas, 2020.
 Source:Data entered into the Health Information Platform for The Americas (PLISA, PAHO / WHO)
by the Ministries
and Institutes of Health of the countries and territories of the Region. Available at: https://www.paho.org/plisa
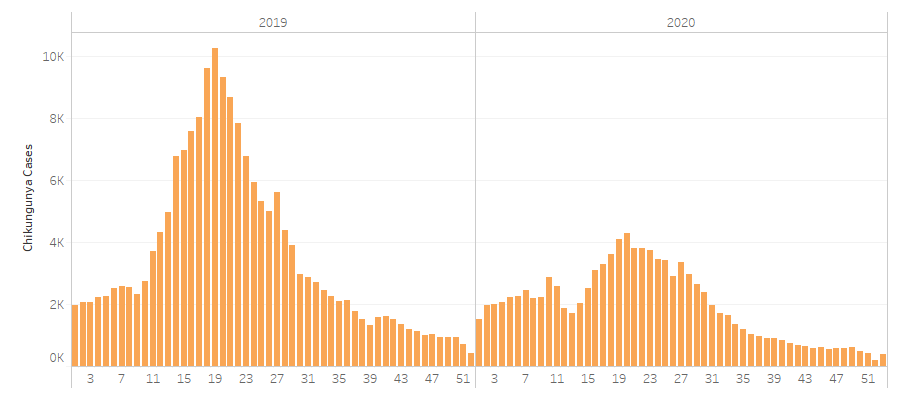
Between EW 1 and EW 53 of 2020, a total of 103046 chikungunya cases were reported in 16 of the 52 countries and territories in the Region of the Americas, of which 39692 were confirmed (38.5 %). The regional cumulative incidence for chikungunya in 2020 was of 10.33 cases per 100,000 population.
The transmission peaks in 2020 were in EW 20 and in 2019 they were in EW 19. The growth rate in 2020 of chikungunya cases between EW 1 and EW 20 was 181%, while the growth rate in 2019 for the same period it was 377%. 29 deaths were reported as associated with chikungunya infection.
Figure 9. Chikungunya cases per epidemiological week (EW). Region of the Americas. 2019-2020
 Source:Data entered into the Health Information Platform for The Americas (PLISA, PAHO / WHO)
by the Ministries
and Institutes of Health of the countries and territories of the Region. Available at:
https://www.paho.org/plisa
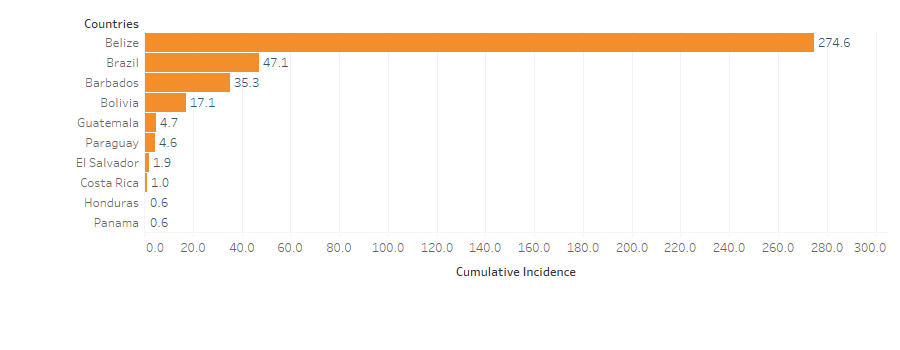
As of EW 53 of 2020, the highest number of chikungunya cases in the Region have been reported by Brazil, with 98177 cases, which represents (95.3 %) of total regional cases. Bolivia follows in case counts with 1913 cases (1.9 %), followed by Belize with 1079 cases (1.0 %), Guatemala with 819 cases (0.8 %), and Paraguay with 316 cases (0.3%). During the same period, 29 deaths attributed to chikungunya infection were reported. The countries with the highest incidence are incluided in Figure 10.
Figure 10. Cumulative incidence of chikungunya cases per 100,000 population. Region of the Americas 2020.
 Source:Data entered into the Health Information Platform for The Americas (PLISA, PAHO / WHO)
by the Ministries
and Institutes of Health of the countries and territories of the Region. Available at: https://www.paho.org/plisa
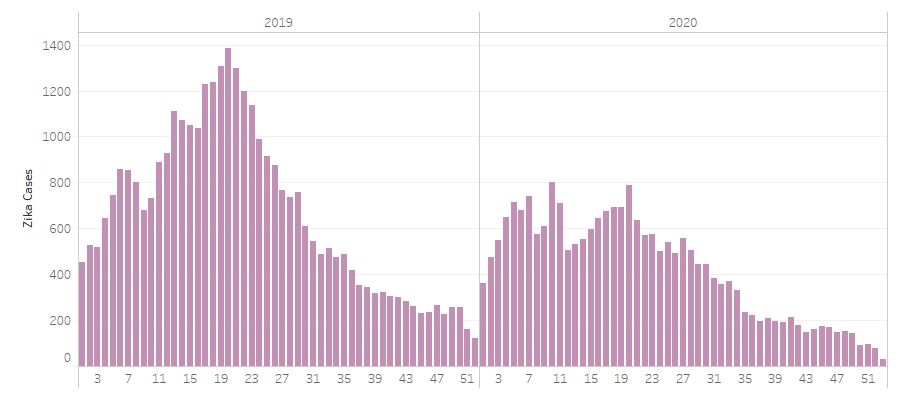
Between EW 1 and EW 53 of 2020, a total of 22978 of Zika have been reported in the Region of the Americas in 17 out of 52 countries and territories. Of all reported cases, 2749 were lab-confirmed (12.0%). The 22978 represents a cumulative incidence 2.41 cases per 100,000 population. Only 1 Zika-related death was reported for the year. Since its first detection in Brazil in March of 2014, local transmission of Zika has been confirmed in all countries and territories in the Americas, except for Bermuda , Canada , Chile , Uruguay (Figure 11). 1 deaths were reported associated with Zika infection.
The transmission peak in 2020 was in EW 10 , in 2019 it was in EW 20. The growth rate in 2020 of Zika cases between EW 1 and EW 10 was 123%, while the rate growth for the same period of 2019 was 66%. 1 was reported as associated with Zika infection.
Figure 11. Distribution of reported cases
of Zika by epidemiological
week. Region of the Americas. 2019-2020
 Source:Data entered into the Health Information Platform for The
Americas (PLISA, PAHO / WHO)
Source:Data entered into the Health Information Platform for The
Americas (PLISA, PAHO / WHO)
by the Ministries
and Institutes of Health of the countries and territories of the Region.
Available at: https://www.paho.org/plisa
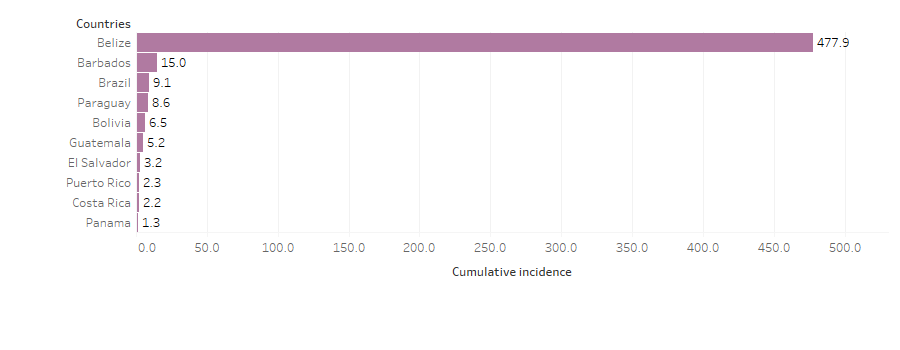
The highest numbers of Zika cases in the Region were reported in the following countries: Brazil with 18941 cases ( 82.4 %), Belize with 939 cases ( 4.1 %), Guatemala with 904 cases ( 3.9 %), Bolivia with 728 cases ( 3.2 %), and Paraguay with 593 cases ( 2.6 %) of cases in the Region. The five countries with the highest cumulative incidence are included in Figure 12
Figure 12. Cumulative incidence of Zika cases per 100,000 population.
Region of the Americas 2020.
 Source:Data entered into the Health Information Platform for The Americas (PLISA, PAHO / WHO)
by the Ministries
and Institutes of Health of the countries and territories of the Region. Available at: https://www.paho.org/plisa
------ Note: As information is updated, PLISA automatically updates data, including retroactively. Therefore, data for any given time period may change as countries update their data.